- Our Work /
- iEXCEL App
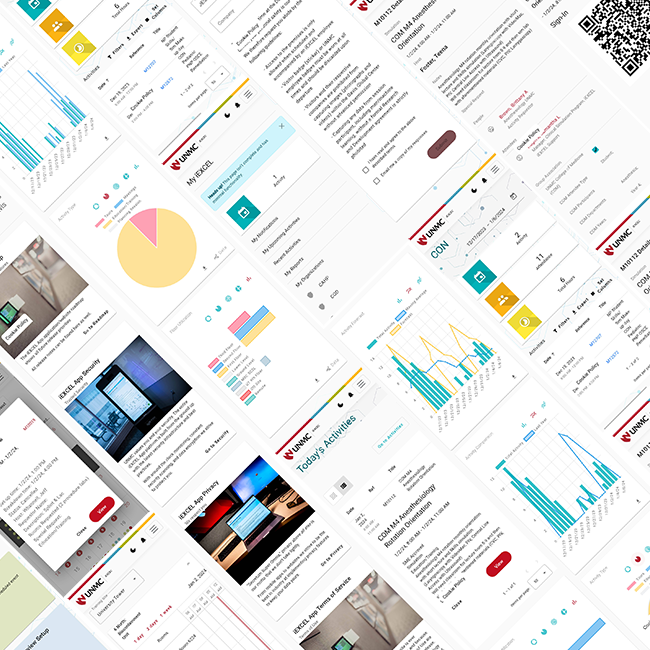
iEXCEL App
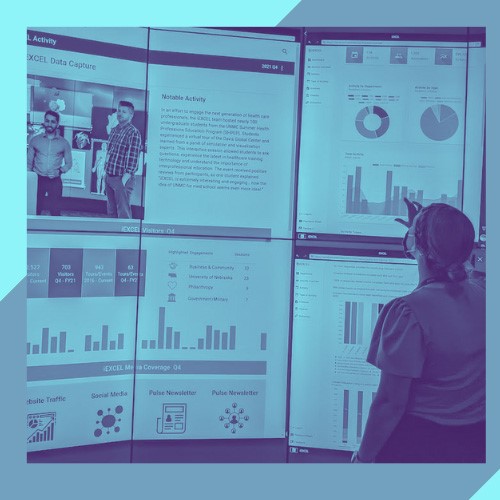
A Simulation Center business analytics and metrics application with advanced reporting, drill-down analytics, and real-time data capture. The iEXCEL App is a purpose-built technology solution for the Global Davis Center.
The application is designed to capture data from the center's activities, events, and simulations. The data is then used to measure the center's performance, manage resources, and make data-driven decisions. The application is designed to capture data from the center's activities, events, and simulations. The data is then used to measure the center's performance, manage resources, and make data-driven decisions.
A cloud hosted, scalable, and completely isolated infrastructure to host advanced data analytics for UNMC's iEXCEL program.
Simulation Center business analytics and metrics are a fairly new data science, and without clear KPI (Key Performance Indicators) being established at the Global Davis Center, the Data Capture team began to collect as much data as possible.
UNMC iEXCEL & Simulation Centers
Transforming healthcare education through innovative simulation technology and data-driven insights
About UNMC iEXCEL
The Interprofessional Experiential Center for Enduring Learning (iEXCEL) at the University of Nebraska Medical Center is a transformative model for healthcare education. Headquartered in the Davis Global Center, it focuses on improving care outcomes by emphasizing interprofessional collaboration and experiential learning.
iEXCEL incorporates advanced simulation and visualization technologies to create immersive learning environments where healthcare professionals can practice skills, procedures, and teamwork in realistic scenarios without risk to actual patients.
The Davis Global Center houses cutting-edge simulation facilities including clinical environments, surgical skills labs, virtual immersive reality, and 3D visualization capabilities, making it one of the most advanced healthcare education centers in the nation.
Data-Driven Simulation
Simulation centers like iEXCEL represent substantial investments in healthcare education infrastructure. Maximizing their effectiveness requires sophisticated data collection and analysis to ensure optimal resource utilization, educational outcomes, and return on investment.
Prior to our application, simulation centers typically relied on fragmented systems and manual processes for tracking activities, resulting in incomplete data, inconsistent metrics, and limited insights for decision-making.
Our purpose-built analytics solution addresses these challenges by creating a comprehensive data collection framework, establishing meaningful KPIs, and providing powerful visualization tools that enable simulation center leadership to optimize operations and demonstrate value.
Key Innovations in Data Analytics
Data Capture Revolution
We implemented streamlined data capture processes that reduced staff workload while dramatically increasing data quality. Automated collection points replaced manual spreadsheets, ensuring comprehensive tracking of simulation activities, equipment usage, and participant demographics.
KPI Development
Working closely with simulation center leadership, we established meaningful Key Performance Indicators that aligned with strategic goals. These included utilization rates, participant throughput, educational outcomes, and financial metrics that provided a holistic view of center performance.
Process Improvement
Data insights revealed operational inefficiencies that were addressed through targeted process improvements. This included optimized scheduling, streamlined room turnover procedures, and refined equipment management, all guided by analytics-driven recommendations.
Advanced Charting & Data Visualization
Transforming complex simulation center data into actionable insights through intuitive visual representations
Visualization Approach
The iEXCEL App features a comprehensive data visualization system designed to transform raw simulation center data into clear, actionable insights. Our approach focused on creating intuitive visual representations that enable administrators to quickly identify trends, patterns, and opportunities.
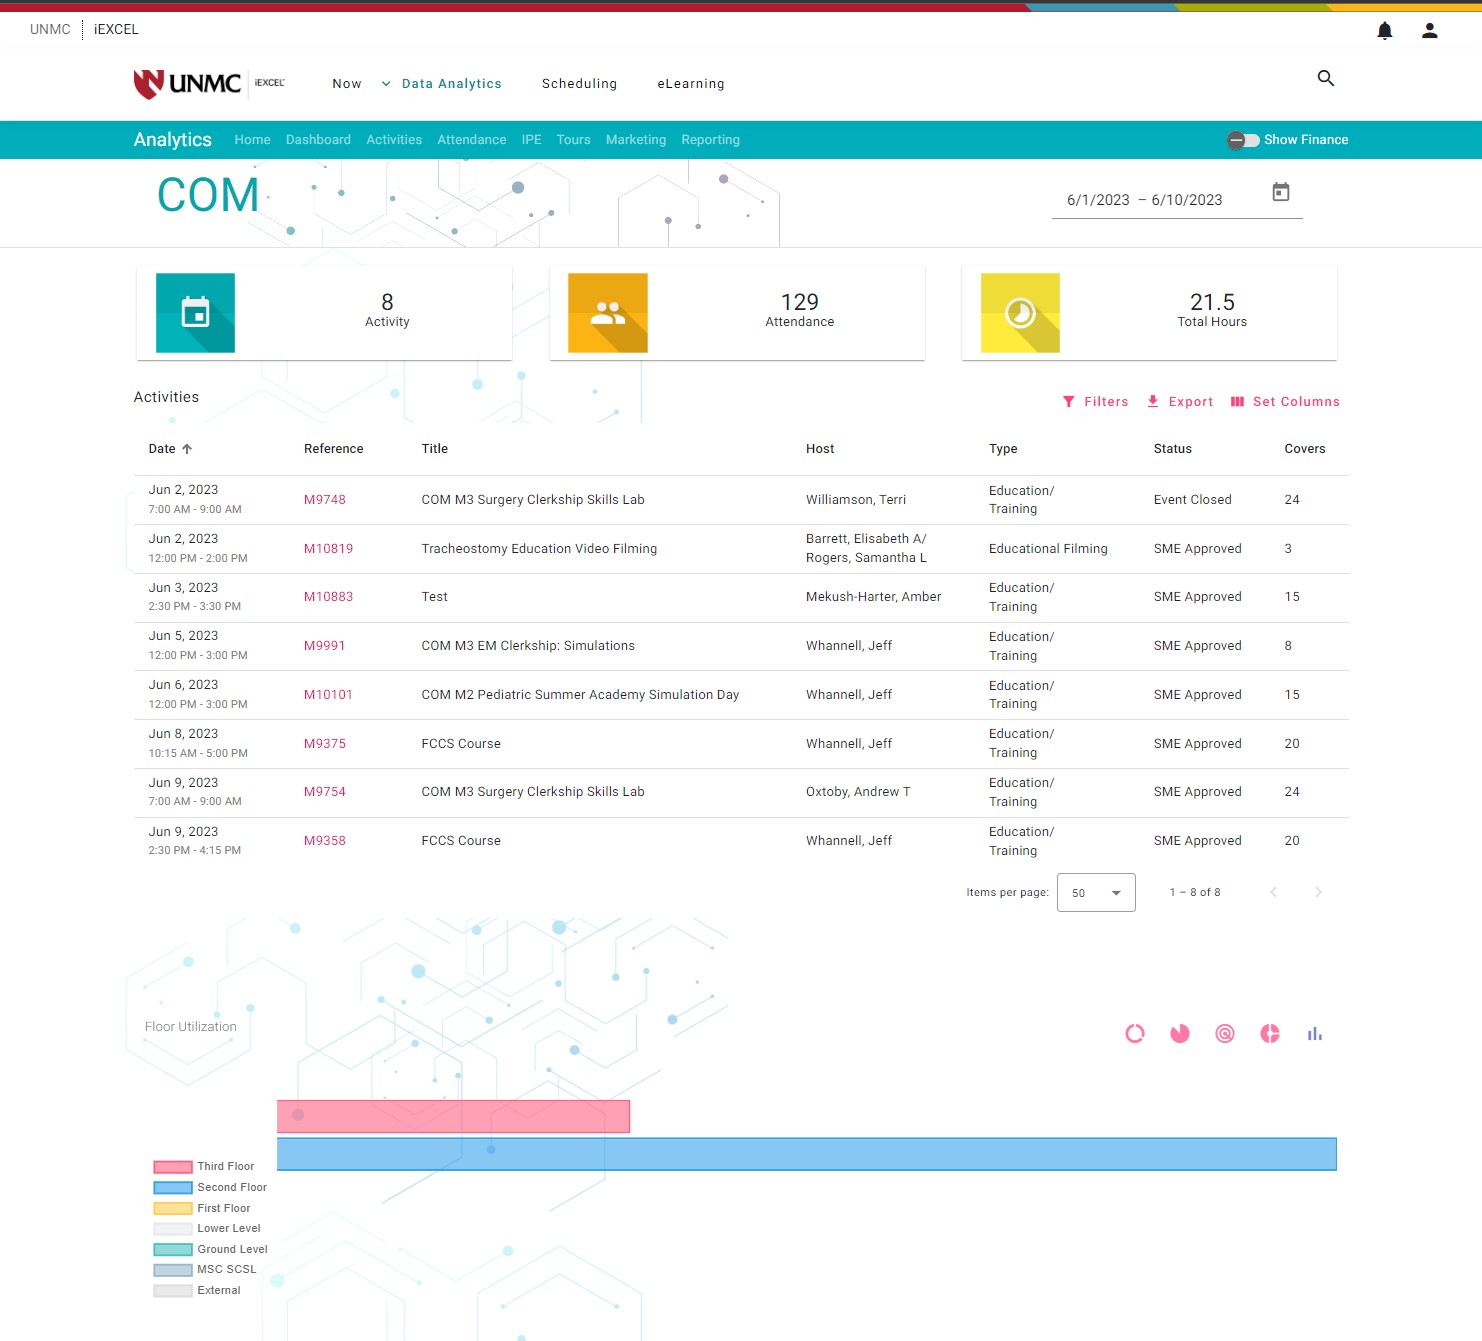
Multi-level Drill-down
Interactive charts allow users to start with high-level overviews and progressively drill down into specific details, from organizational performance to individual room utilization.
Contextual Comparison
Visualizations automatically incorporate relevant benchmarks and historical data to provide context for current performance metrics.
User-customizable Views
Stakeholders can customize dashboards to focus on metrics most relevant to their role, saving preferred configurations for future sessions.
Visualization Types
Interactive Dashboards
Dynamic dashboard interfaces with real-time data updates and configurable widgets for at-a-glance performance assessment, allowing leaders to monitor KPIs instantly.
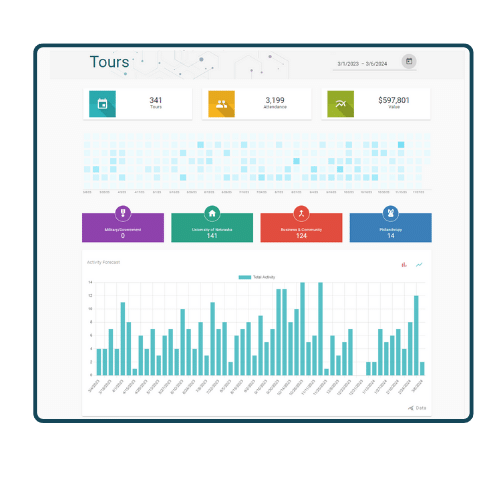
Temporal Analysis
Time-series visualizations revealing seasonal patterns, growth trends, and utilization cycles that inform staffing and resource allocation decisions.
Spatial Heat Maps
Color-coded facility maps displaying utilization intensity across different spaces, highlighting high-demand areas and underutilized resources.
Relationship Networks
Network diagrams visualizing interprofessional collaboration patterns, revealing which departments or specialties frequently train together.
Business Impact
Our advanced visualization capabilities transformed how the simulation center operated, enabling data-driven decision-making at all levels of the organization.
Resource Optimization: Identified underutilized spaces and equipment, leading to a 23% improvement in overall facility utilization.
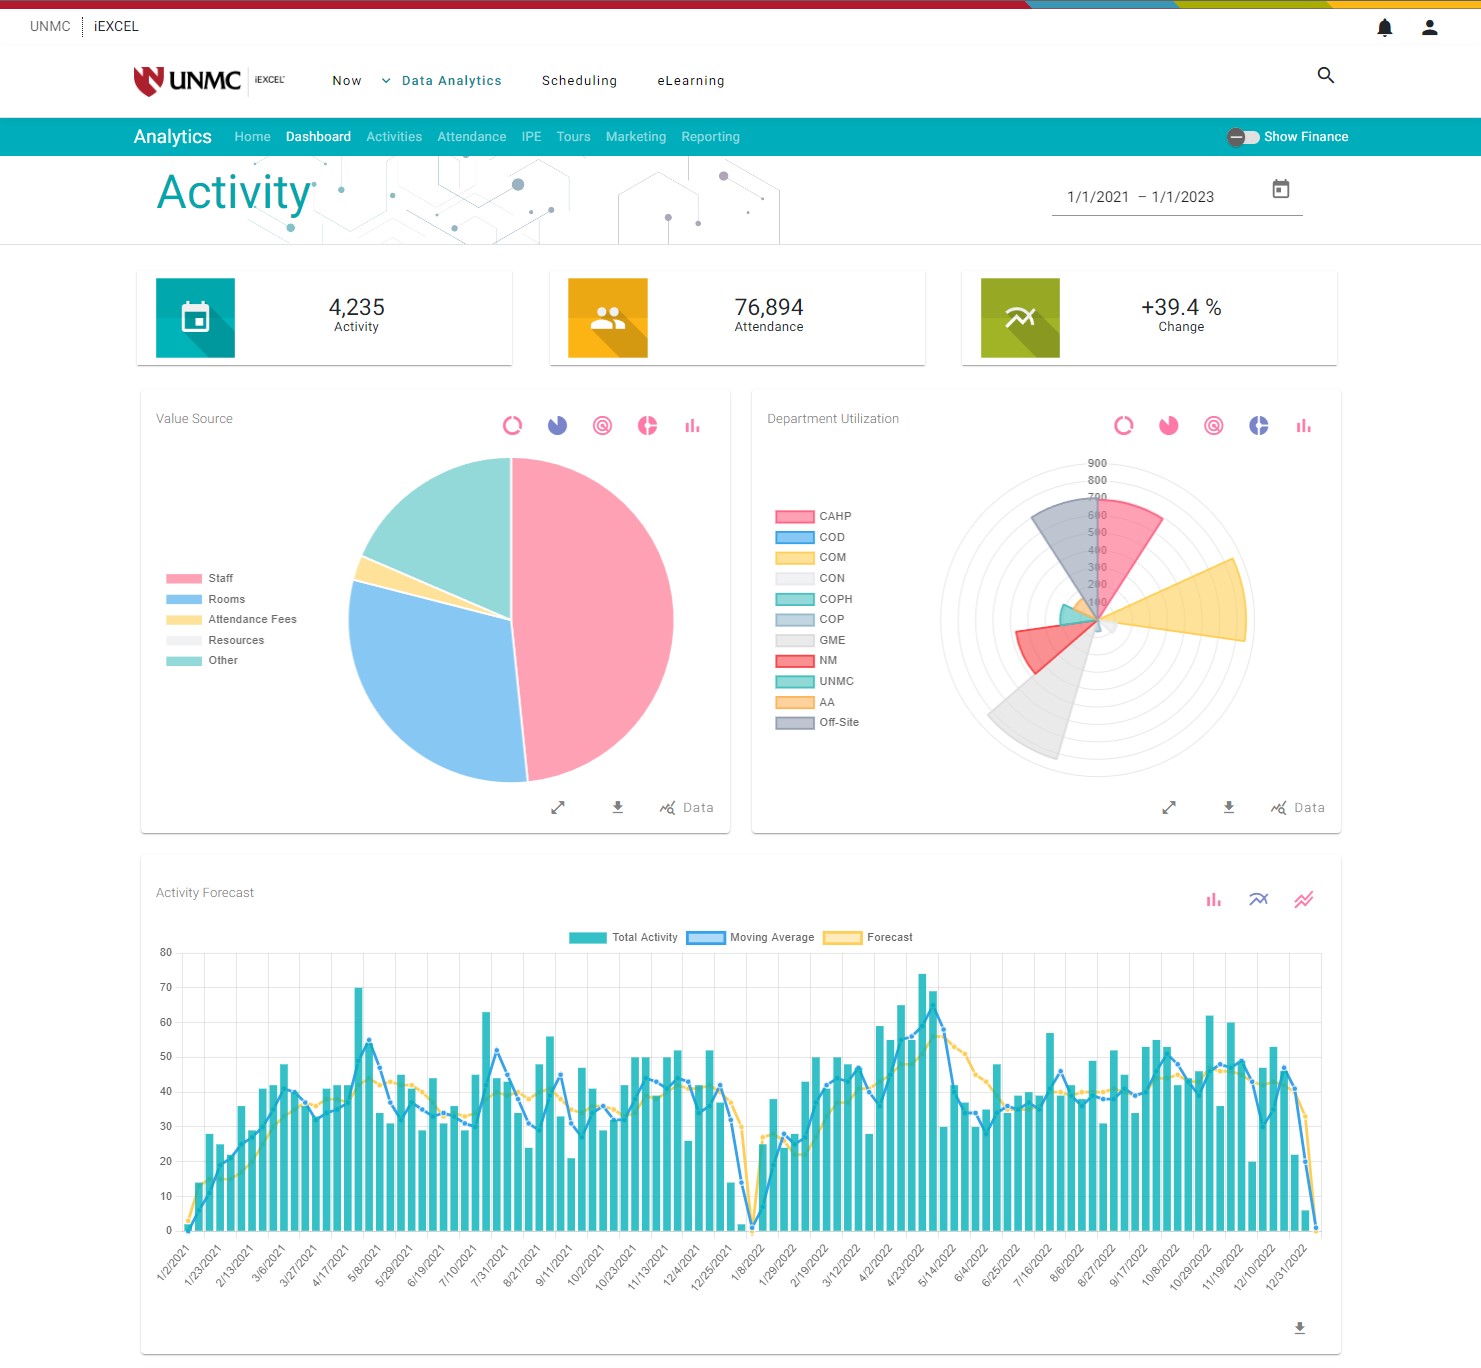
Financial Transparency: Visualized cost drivers and revenue sources, enabling leadership to strategically expand profitable service offerings while optimizing expenditures.
Data-Driven Planning: Forecasting visualizations identified peak demand periods, allowing proactive staffing adjustments and resource allocation.
Demonstrable ROI: Generated compelling visual narratives of center impact for stakeholders, supporting continued investment and expansion of simulation activities.
Visualization Technology Stack
The visualization capabilities were built on a robust technical foundation that balanced performance, flexibility, and ease of use:
Front-end Framework
Angular with comprehensive charting libraries including D3.js for custom visualizations and ngx-charts for pre-built components.
Real-time Processing
SignalR-based websocket connections for live updates to dashboards as new data is captured in the system.
Data Aggregation
Custom ETL processes with Azure Functions to transform raw activity data into optimized formats for visualization.
Export Capabilities
PDF and Excel export functionality for all visualizations, with custom formatting for reports and presentations.
Scope of work
Every design journey starts off with a wireframe of all the requested features and a plan for user flow through the web app.
All of these features were built out in a cloud hosted Azure app that is completely isolated and in a secure tenant. The app is built to scale and can be handed off to a production environment or solution owner.
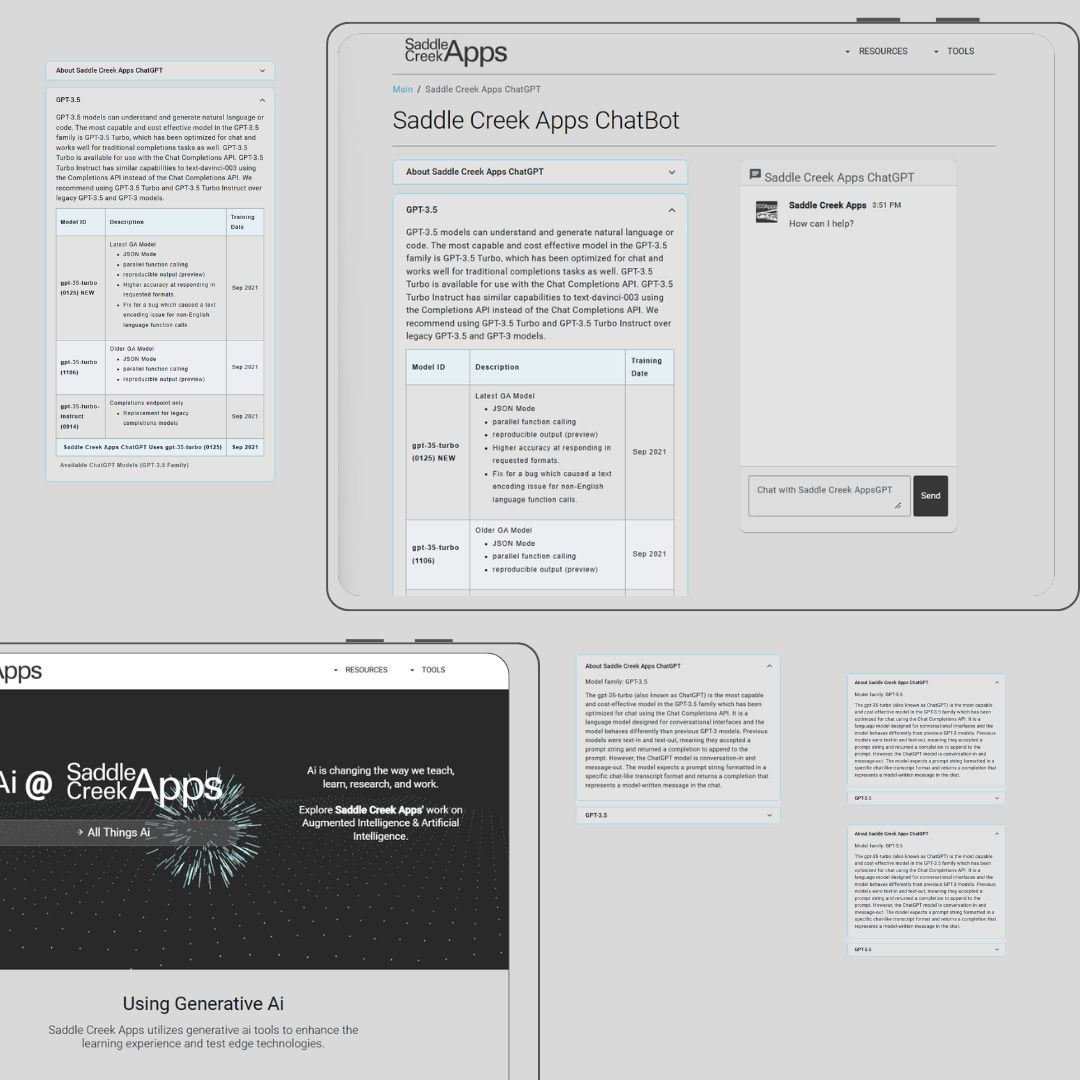
This MVP build includes a ChatGPT, Bing Ai Search, Ai News and was stood up to capture the vision of the UNMC Ai Committee and faculty. We have discovered that many of the tools and resources are already available and can be integrated into the app. And that just having a physical place to explore Ai tools and resources is a great asset to spark the possible solutions for Ai.
Data Normalizing
- Status Quo Research
- Requirements Document
- Project Scope
UI/UX Design
- Wireframes
- User Flow
- Feature Requests
App Build
- Angular App
- API Gateway
- Azure Services
Research & Design
A lot of time was spent researching the current Ai tools and resources available to UNMC. This research was used to create a requirements document and project scope.
The project scope was used to create wireframes and a user flow for the app. The wireframes were used to create a feature list and a plan for the MVP build.
Data Capture
Simulation Center business analytics and metrics are a fairly new data science, and without clear KPI (Key Performance Indicators) being established at the Global Davis Center, the Data Capture team began to collect as much data as possible.
Casting a broad net, the data began to show growth opportunities, where the Global Davis Center shined, and interprofessional learning gaps. This data science led the team to create C-Suite dashboards, KPI's, and automated reporting for academic certification. Having access to timely and accurate activity data within the center enabled the staff to better manage resource utilization, inventory, and prep for upcoming activities.
Agile Development
Small apps solving big problems. The iEXCEL App is a purpose-built technology solution for the Global Davis Center. The application is designed to capture data from the center's activities, events, and simulations. The data is then used to measure the center's performance, manage resources, and make data-driven decisions.
Analytics & Tracking
The iEXCEL Measures of Success (MOS) are the key performance indicators (KPIs) that we use to better our organization. These KPIs are the metrics that we use to measure our performance. We use these metrics to help us make better decisions and to help us better understand our organization. We use these metrics to help us make better decisions and to help us better understand our organization.
Version 1
Version 1 of the iEXCEL App was a success. The app was built to replace a quarterly newsletter that staff at iEXCEL would spend hours calculating metrics to include in the report. Automating this process saved the team countless hours and also allowed us to create better ways to capture the data we needed. We designed processes to add value wherever they were being implemented. This allowed us to capture data that we had never captured before. This allowed us to create new metrics and to better understand our organization.
Green Tree Development
Deriving financial metrics from the data we were capturing was a challenge. Pricing models were created to help us understand the value of the data we were capturing, the utilization rates, the consumables used, and the cost of the staff. We were able to create a financial model that allowed us to understand the value of the data we were capturing. This allowed us to create new metrics and to better understand our organization.


Research & Design
What started out as a simple data capture tool has evolved into a powerful business analytics and metrics application. The processes being implemented for better analytics which led to better insights and better decisions.
The iEXCEL App was built in a maintainable way, allowing us to add new features and to make changes to the app as we learned more about our organization. We were also able to repeat this solution process for our other apps.
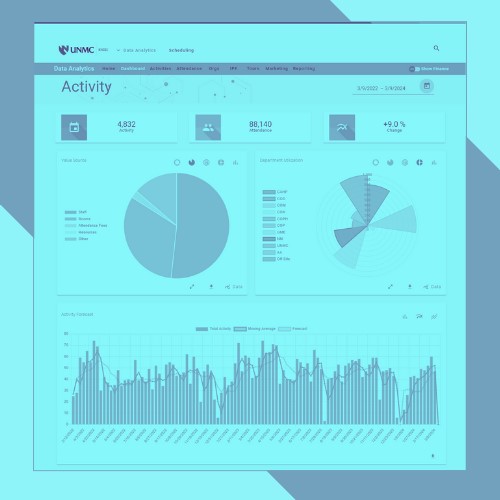
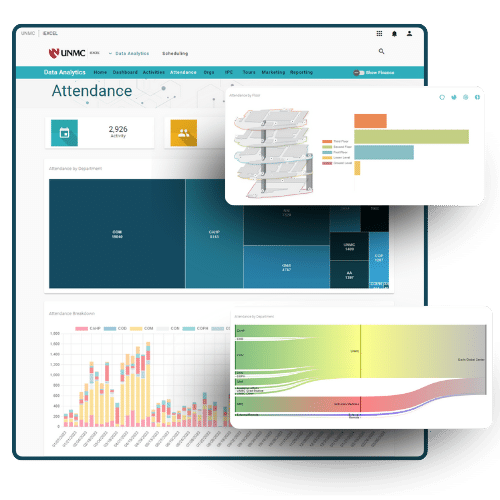
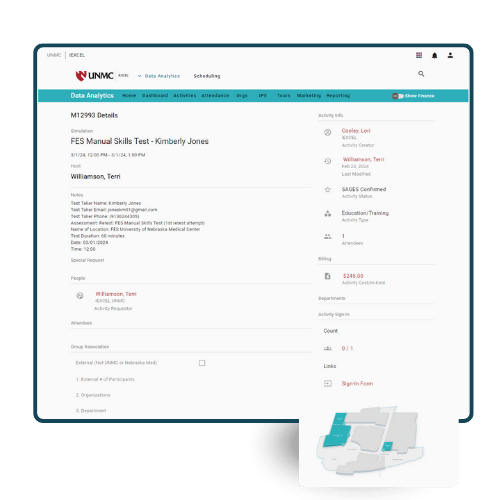
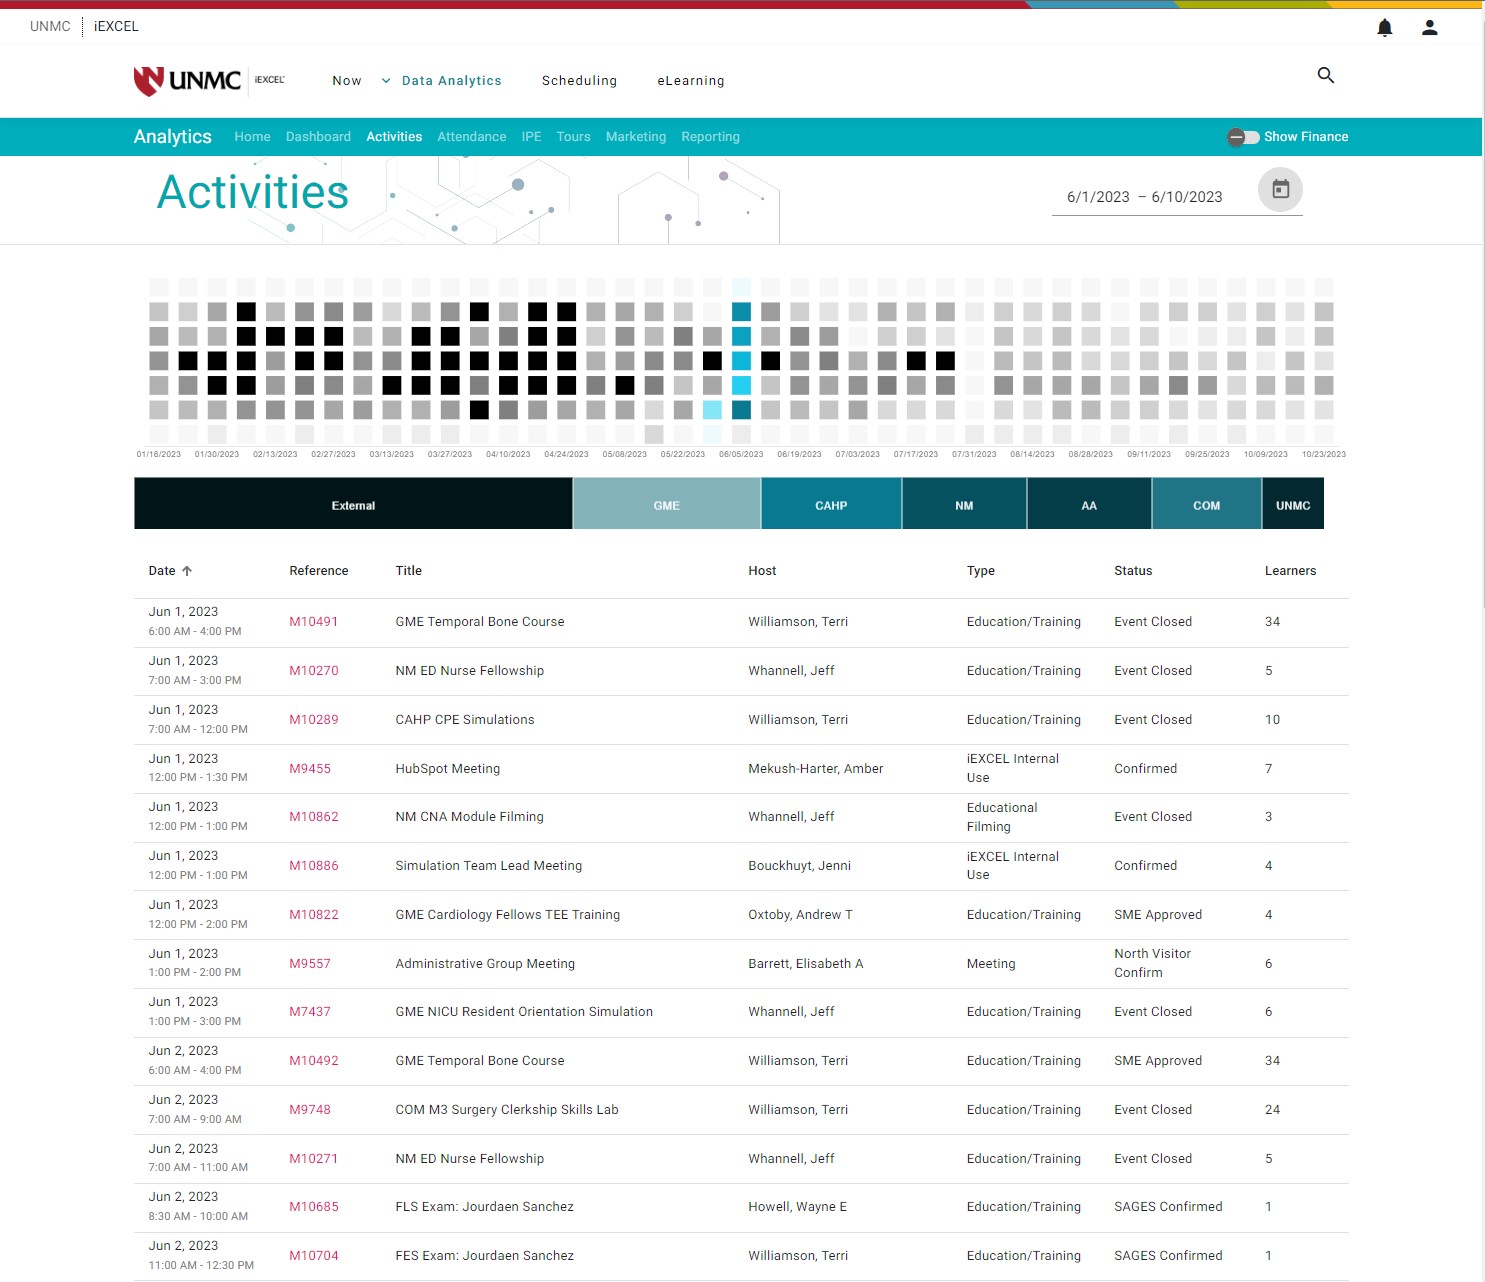
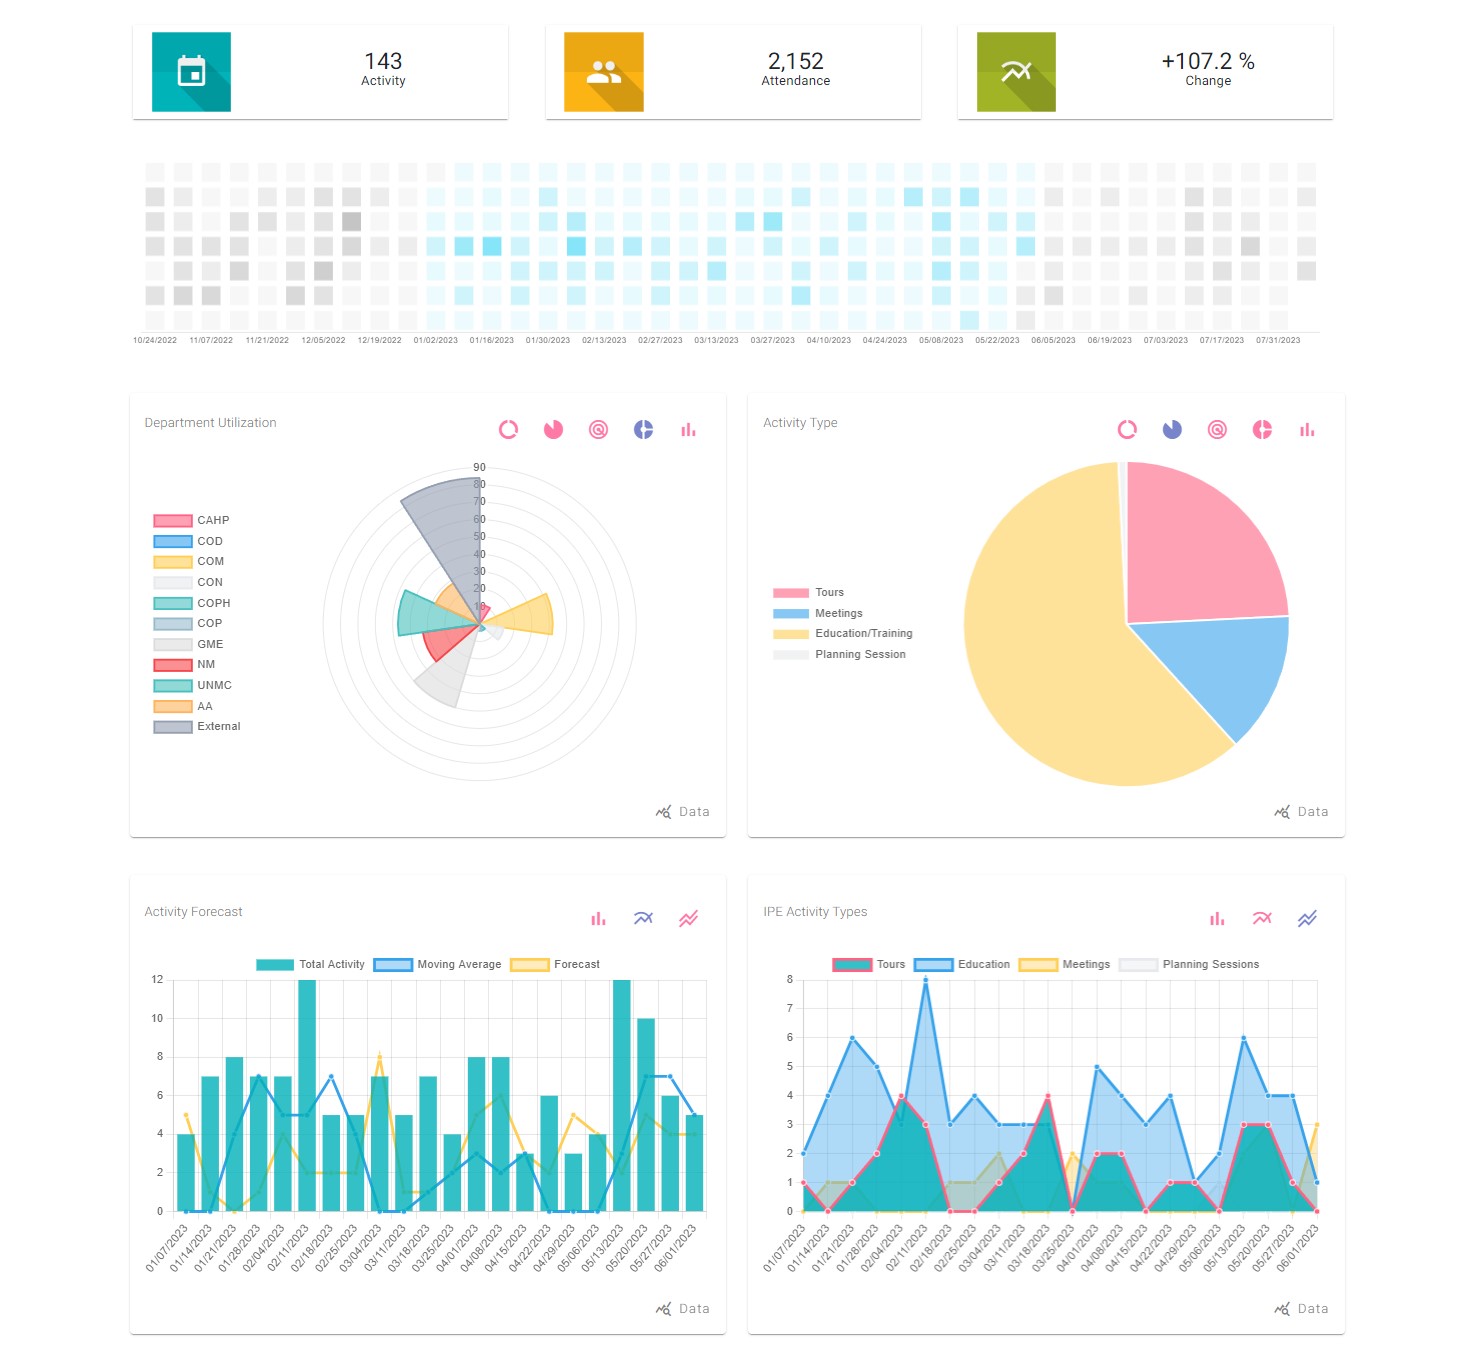
Dashboard
The dashboard was the starting point on redesigning the application. It is meant to be a top level look at everything, the thousand-foot view. From here, users can drill down into what they cared about, what floor they were on, or what room they were in. This was the first step in the redesign of the application.
Charting
The iEXCEL App has a robust charting system that allows users to visualize the data in a way that makes sense to them. Every data point can be displayed in multiple ways, and the user can choose the best way to display the data. This allows the user to see the data in a way that makes sense to them and to make better decisions.
UI Design
This web app is designed to be an analytics powerhouse, with top level analytics to guide decision-making and drill down analytics to drill down into the details. There is a gap in technology for simulation centers that are currently being filled by using a combination of tools meant for other industries. The iEXCEL App is a purpose-built technology, built by simulation center professionals for simulation center professionals. Our mission is to provide a single source of truth for the Global Davis Center.
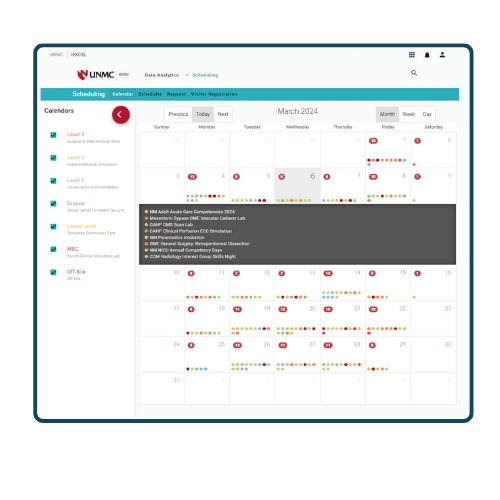
The flexible charting features, calendars, and data source views in the UI design reflect this mission. Our design team worked closely with data scientists to make sure that the data was displayed in a way that made sense to the user. The UI design is meant to be approachable, intuitive and easy to use, with a focus a heavy on the user experience.
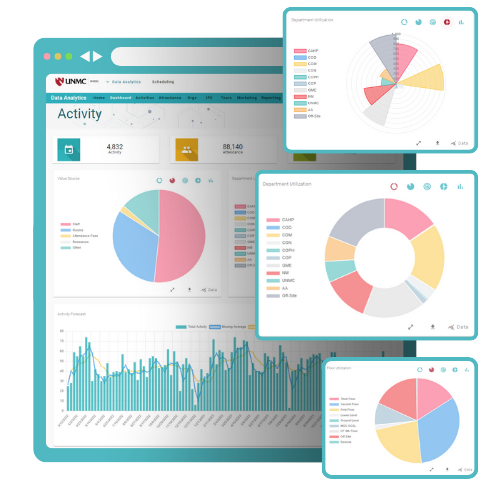
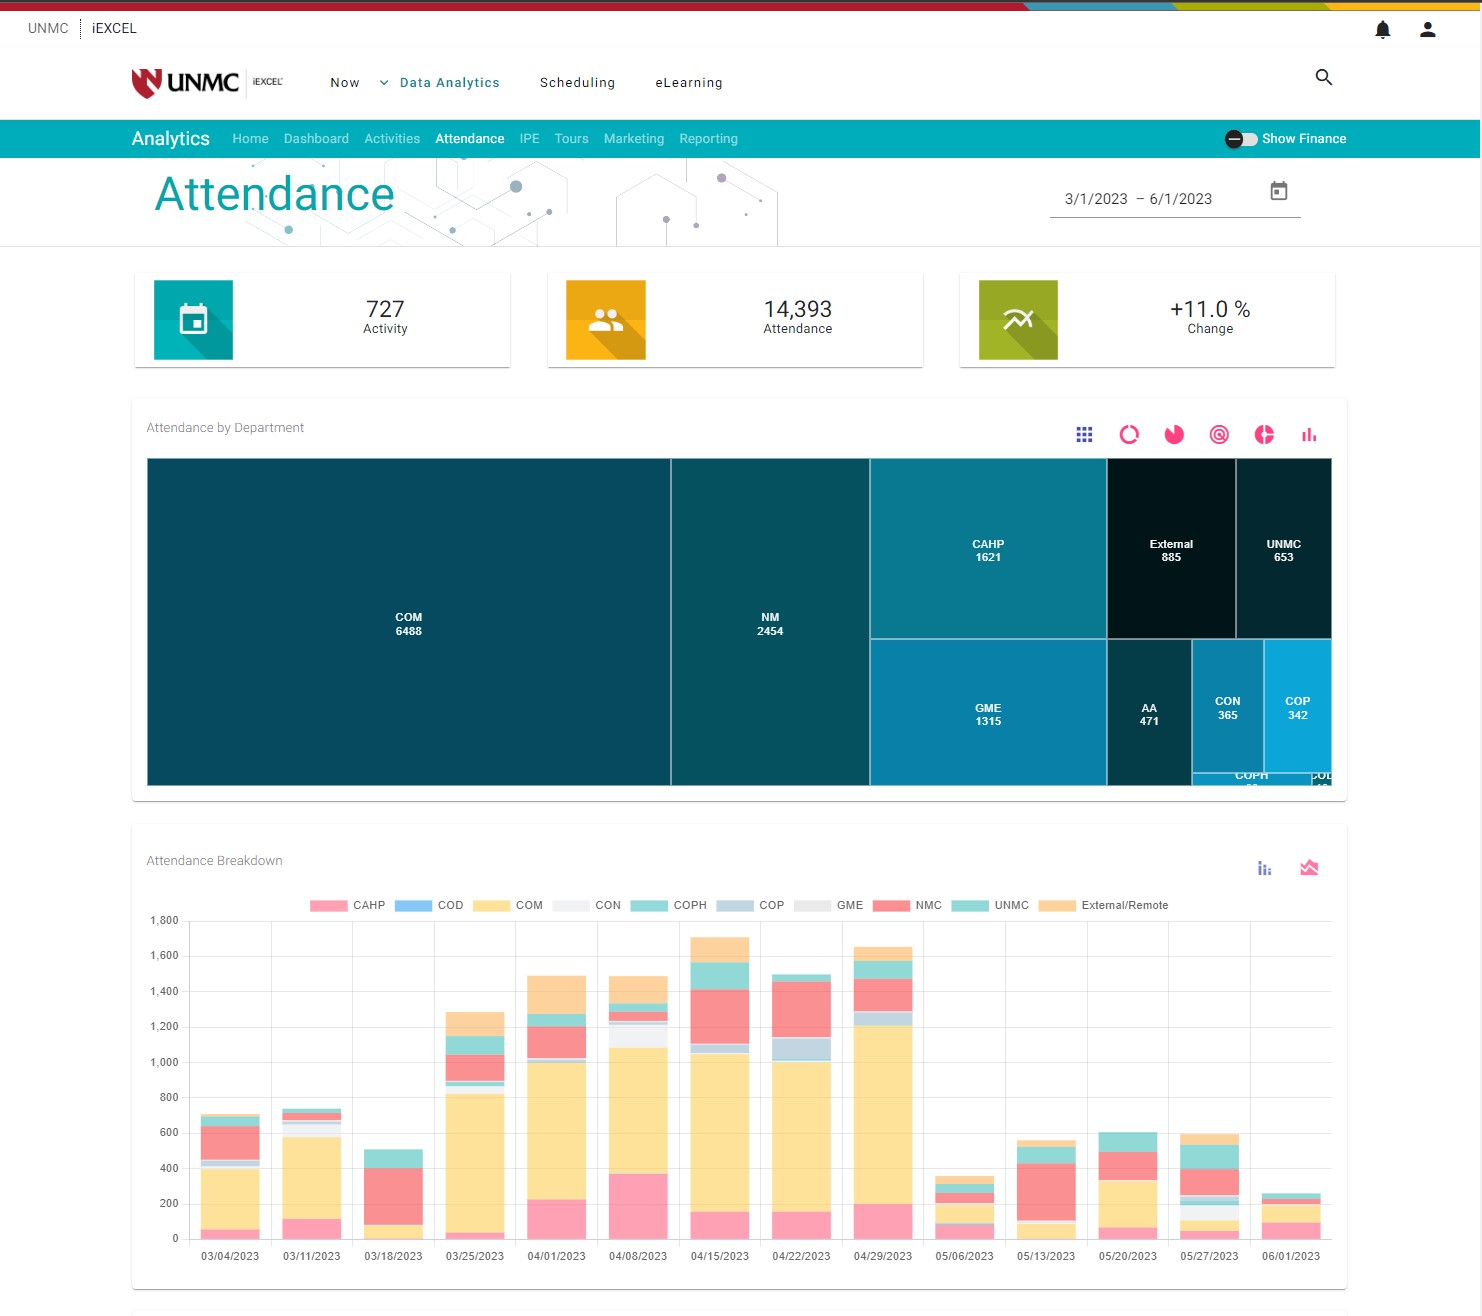
Analytics Made Easy
Transformational and informative: dashboards, metrics, and real-time data. Every piece of data captured by our ground-breaking iEXCEL App system can be viewed in multiple charting formats, and the data behind these charts, can be analyzed.
Deep dive into the data to ensure data accuracy and make informed decisions to better capture the metrics you need. Our easy-to-use interface makes data validation intuitive and understandable. Use some of the most powerful analytic tools in the industry today.
Industry leading analytics. Powerful tools to analyze what matters.
Innovation drives metrics, metrics drive innovation. Gain insight & dive into the data that's pushing innovation.
Dive into the Data
Keep clicking! You can start at the C-Suite high-level organizational view and drill into the numbers, all the way down to the number of individual 20-gauge needles being used in the simulation. See what you want to see with our innovative dashboards and customizable home screens. Every member at every level of the organization can view what matters to them in seconds.
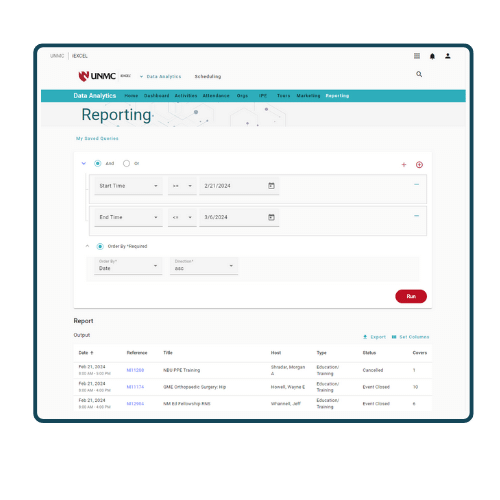
Search, filter, sort the data and then automate reports to be sent to key stakeholders. That's the power of this application. Real insight meets real business operations. Every functionality was designed by the staff and end users to make this app so intuitive there's no training needed.
Your reports, how you want them. Schedule reoccurring reports to be delivered right to your e-mail.
Manage Everything
Managing a simulation center is a tall order. Managing 10-15 separate systems to manage a simulation center is bordering on impossible. Our team has decades of experience in integration and data migration, and all of this experience is built into these easy-to-use tools.
Connect all of your systems to iEXCEL App/Solutions, via our API Data Sync feature and truly manage everything.
Create a Data Lake with all your endpoints. Make the unmanageable, manageable.
We don't just connect your systems to ours, we analyze everything for accuracy using our Machine Learning integration protocols.
Attendance Analytics
Currently Piloting! We are piloting the feature now.
Gain powerful insight into who is using your facility. From internal staff, to students, to vendors and touring guests, iEXCEL App/Solutions tracks everything. Our attendance tracking system is non-invasive and adds value to both your guests and staff. Guests get access to activity information, recaps, notes, and even transcripts of the entire activity if the instructor wants.
Our goal is to provide seamless automation and data collection while adding meaningful value at every level of the organization. This isn't something you have to implement and force staff adoption, iEXCEL App/Solutions and its features are something everyone wants to use.
Real-time attendance tracking & notifications.
Keep everyone connected & updated on activity changes.
Manage attendees & capture IPE metrics.
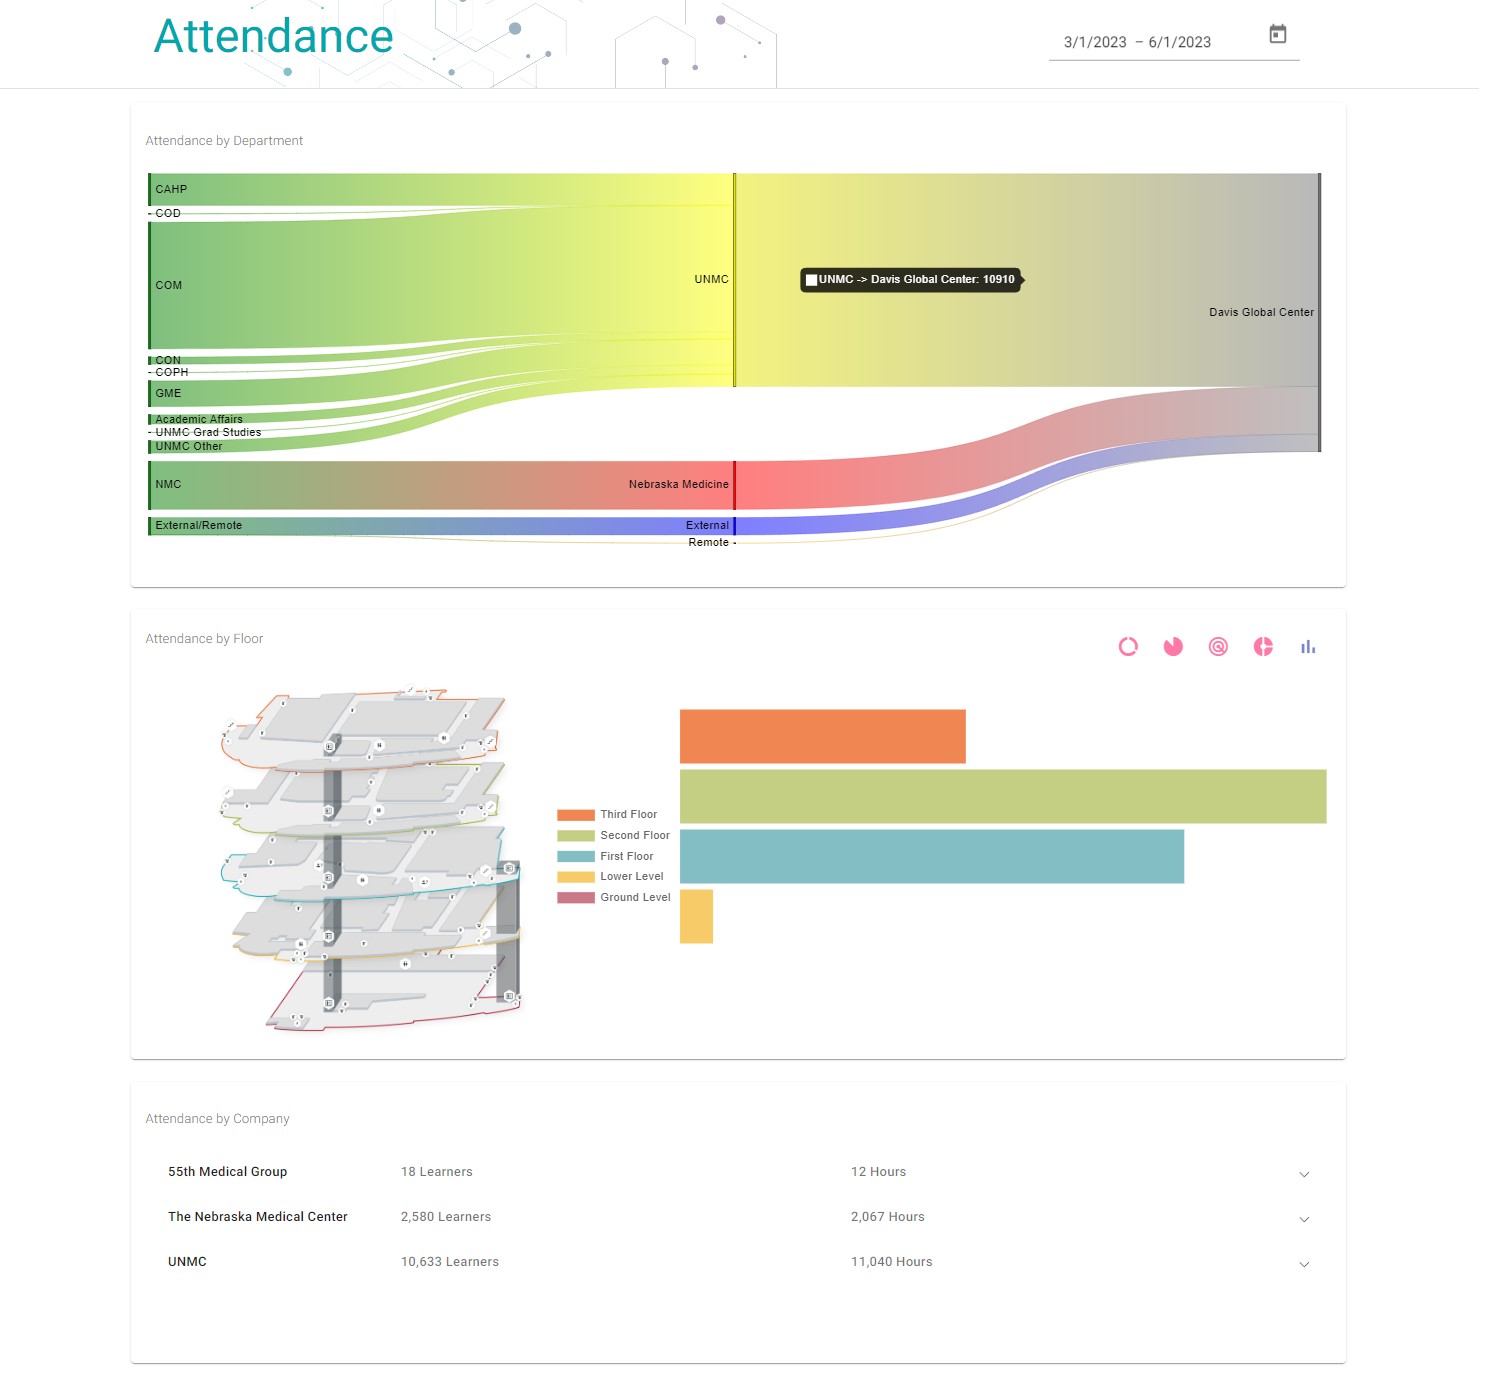
Attendance Explorer
Capture the flow of attendees, students, and guests. See who your organizational partners are and discover how to better collaborate with these groups. At iEXCEL we literally have it in our name to build interprofessional relationships. The attendance analytics captured all drive insight into how to build these partnerships.
Discover what groups are working together and what groups are missing out on partnerships and possible collaborations. Build your community and reach more attendees with these powerful tools. Create custom reports, alerts, and notifications to business partners to ensure every collaboration is not a missed opportunity cost.
Egress & ingress data capture. Know your audience and engage.
Gain powerful insight on vendors & external visitors.
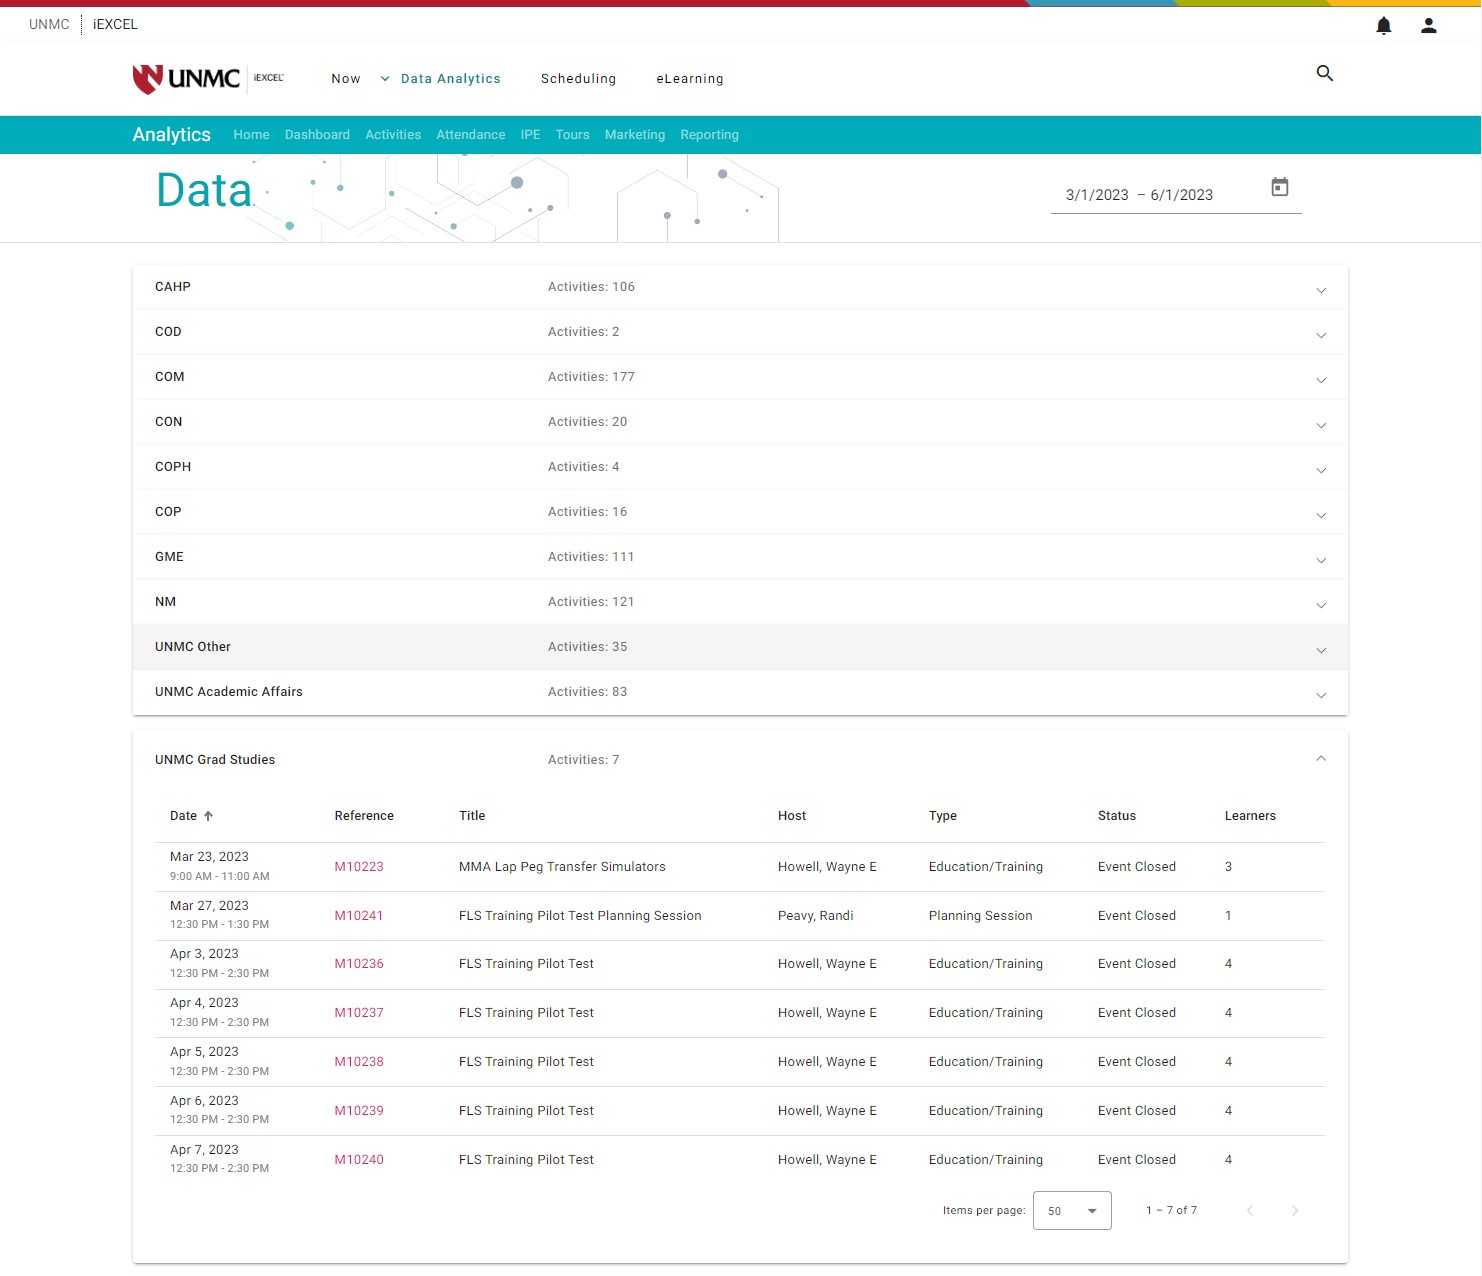
Organizational Rollup Reporting
Rollup reporting is a type of report format in which all levels of a company or organization are assigned a report level. Typically, the broadest level of an organization is assigned the lowest reporting level.
Break out reporting built to empower your partners and customers. Easy to implement and manage organizations, colleges, and external partners in iEXCEL App/Solutions creates pre-built reporting.
Build and share custom department metrics with your business partners. Create complete transparency and best practices with easy analytics and scheduled reports.
Rollup reporting by a department or multiple departments and share it.
Interprofessional Analytics
Interprofessional collaboration occurs when 2 or more professions work together to achieve common goals and is often used as a means for solving a variety of problems and complex issues. Interprofessional-ism is one of the most important functions at iEXCEL and iEXCEL App/Solutions strives to capture this collaboration.
Teams in health care consist of diagnosticians, prescribers, medication experts and members who tend to the ongoing daily needs of the patient. Historically, each profession trained independent of each other but at iEXCEL collaboration is the goal.
Gain insight into who is collaborating with whom.
Find those missed opportunities and celebrate your successes!
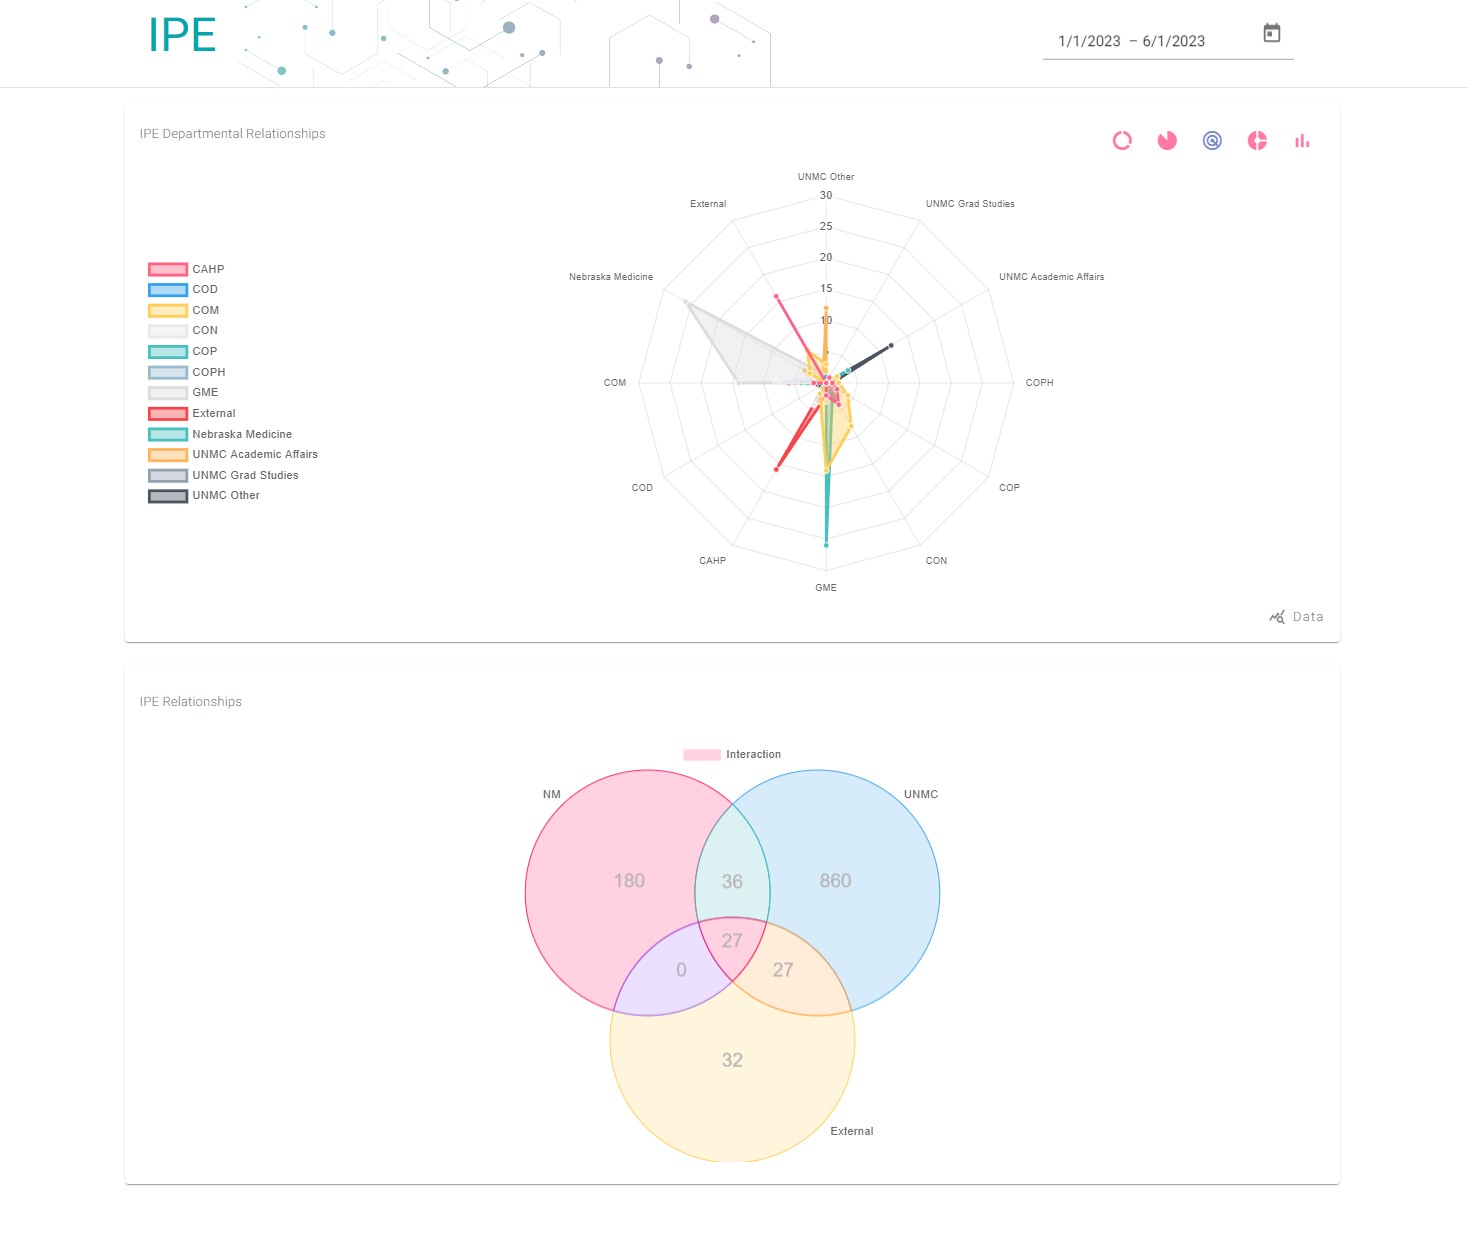
See Who Works Together
Healthcare works when we all work together. For example, if someone checks into the emergency room with shortness of breath, they may see multiple medical professionals who assess and diagnose the issue. Working together, these individuals can share their findings, assumptions and recommendations to develop the best way to treat the patient.
The competencies extend to the four domains which encircle interprofessional collaboration are: (1) clinical and professional practice and care, (2) education, (3) research and quality improvement, and (4) approach to leadership.
Interprofessional collaboration improves healthcare systemically.
Our facilities are built for Interprofessional Collaboration.
Interprofessional collaboration positively impacts all collaborators.