- Our Work /
- NCI Dashboard
NCI Dashboard
This was a solution that rebuilt an existing web app using modern architecture & design.
National Core Indicators® - Intellectual and Developmental Disabilities (NCI®-IDD) is a national effort to measure and improve the performance of public developmental disabilities agencies.
NCI, Nebraska DHHS, and UNMC MMI partner to provide this data in an understandable and readily available format. The current data is managed in PowerBI and is at the limit of what this product can provide.
This web app is still being refined.
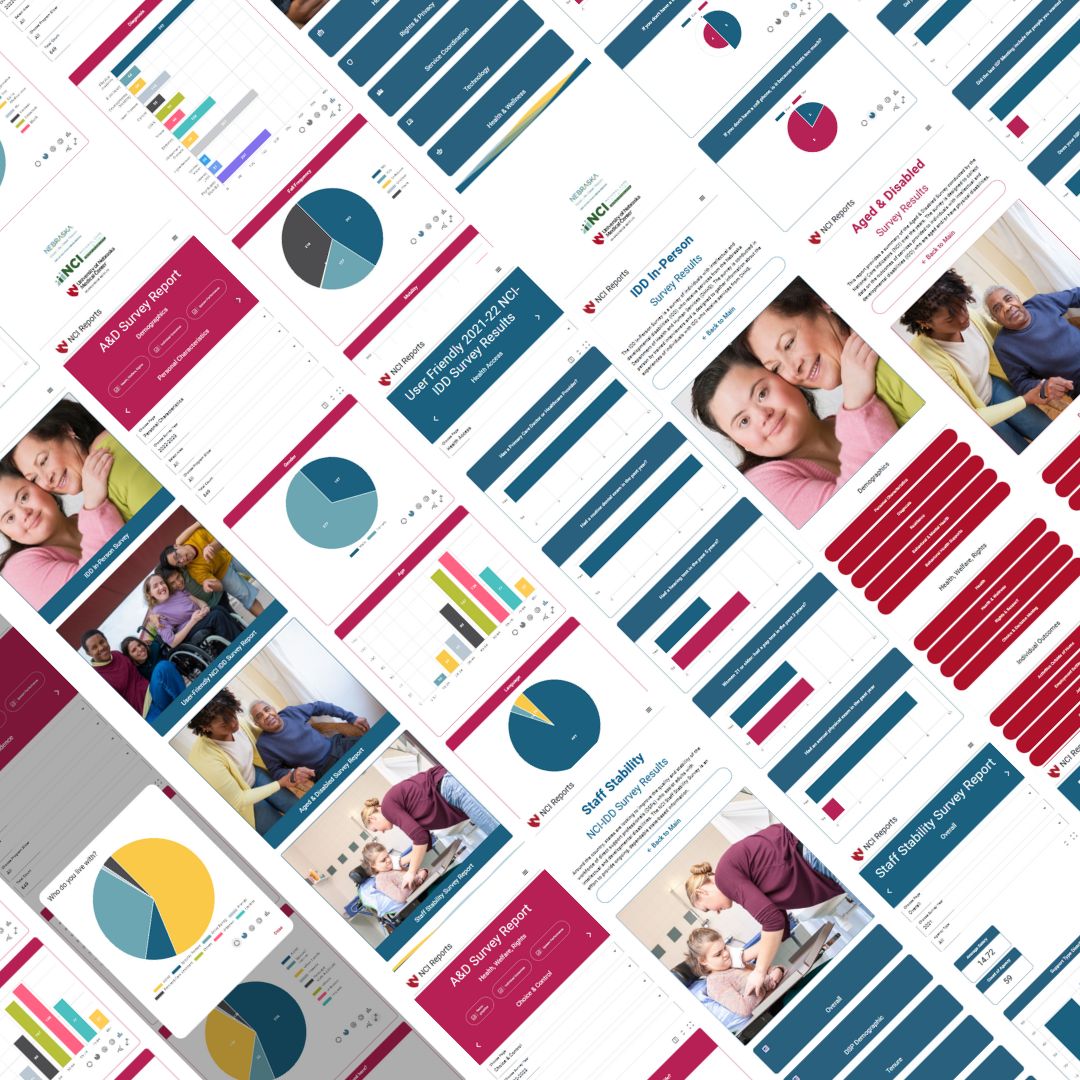
The NCI Dashboard project was a solution that rebuilt an existing web app using modern architecture & design. The data needs to be presented in a way that is easy to understand and navigate. The data results are used by a wide audience with many different needs.
NCI, Nebraska DHHS, and UNMC MMI partner to provide this data in an understandable and readily available format.
The current data is managed in PowerBI and is at the limit of what this product can provide. The project includes future language offerings and ADA Disability compliance.
Project Design UI/UX Image CDN Cloud Hosted Graphic Design Analytics Data Science Advanced Charting API Gateway Instructional Design
Scope of work
This was a really successful PowerBI web app before coming to us. The needs of the client were pushing the limit of what PowerBi could offer, and refactoring this into a more usable format was the most viable option.
The team at UNMC's MMI was passionate about their audience's needs and conveying the information as clearly as possible to all of Nebraska.
This final build includes a static web app.
Research & Design
- Source Data
- Audience Analysis
- Design Documents
Data Visualization
- Wireframes
- Advance Charting
- Data Management
App Build
- Angular App
- Cloud Hosted
- Data Exploration
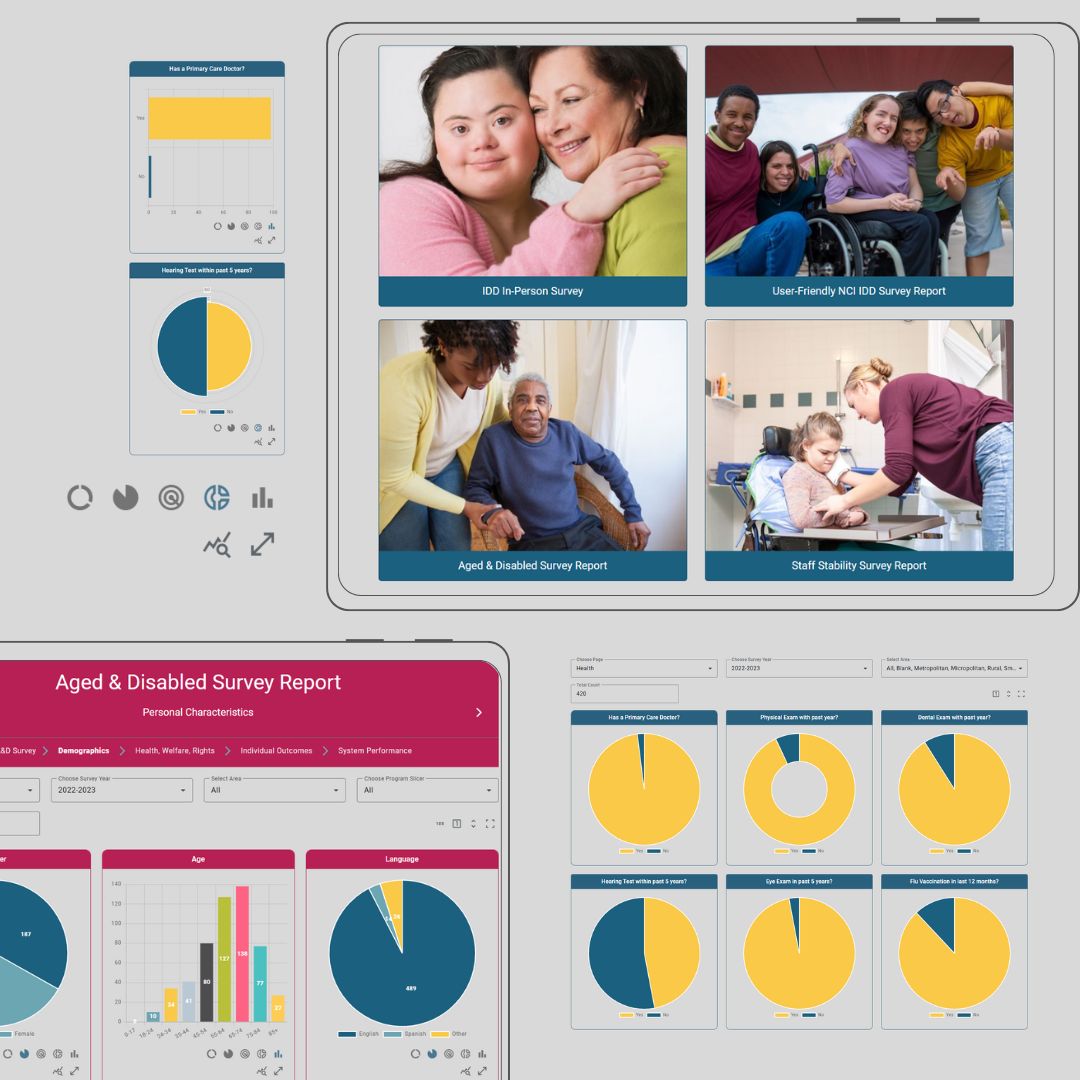
Customizable Charts & Visualization
For the NCI Dashboard, implementing customizable visualizations using Chart.js was crucial to the project's success. Unlike the limitations faced with PowerBI, our custom charts allow for:
- Complete control over visual representation of complex data
- Accessible design features for users with disabilities
- Responsive layouts that work across all devices
- Interactive elements that engage users with the data
By leveraging Angular Material's UI components alongside Chart.js, we created a cohesive, intuitive interface that makes complex statistical data understandable to diverse audiences.
10x Performance with Redis Caching
The NCI Dashboard utilizes complex data visualizations that previously created significant loading delays. By implementing a Redis cache server, we achieved:
- 10x faster rendering of visualization components
- Reduced API calls to data sources
- Consistent performance during high traffic periods
- Near-instant data retrieval for frequently accessed charts
The Redis implementation stores pre-processed visualization data, eliminating the need to transform raw data for each user session. This approach significantly improves the user experience while reducing server load.
Technology Stack
Azure Static Web Apps
Hosting the NCI Dashboard on Azure Static Web Apps provided several advantages:
- Global CDN distribution
- Seamless CI/CD integration
- Built-in security features
- Cost-effective scaling
Chart.js
Chart.js enabled us to create accessible, responsive visualizations:
- Eight chart types
- Responsive design
- Animation capabilities
- Interactivity options
- Accessibility features
Angular Material
Angular Material provided a comprehensive UI component library:
- Consistent design language
- Accessible components
- Responsive layouts
- Theme customization
- Form controls and validation
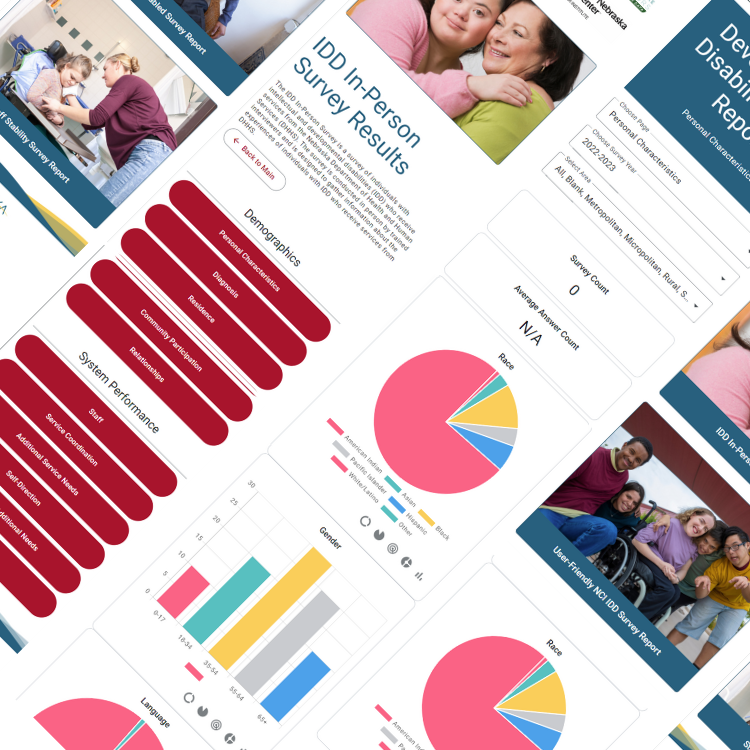
Project Deliverables
National Core Indicators® - Intellectual and Developmental Disabilities (NCI®-IDD) is a national effort to measure and improve the performance of public developmental disabilities agencies. NCI, Nebraska DHHS, and UNMC MMI partner to provide this data in an understandable and readily available format. The current data is managed in PowerBI and is at the limit of what this product can provide.
The project includes future language offerings and ADA Disability compliance. The data needs to be presented in a way that is easy to understand and navigate. The data results are used by a wide audience with many different needs.
Research & Source Data
The source data came from several Excel files and PowerBI reports. We needed to create a web app that could display the data in a way that was easy to understand and navigate. The data results are used by a wide audience with many different needs.
The data was compared to the existing PowerBI reports to ensure that the data was accurate and that the new web app would be able to display the data in a way that was easy to understand.